Insights to Action: Choose the Top Dashboard Development Company in Bangalore
Brandstory Solutions is at the forefront of the top dashboard development companies in Bangalore, offering a comprehensive suite of solutions data management and visualization. Our range of dashboard solutions utilizes both readily available applications and custom development applications to effectively present and interpret data patterns, facilitating clear communication of messages and frequent comprehension of data.
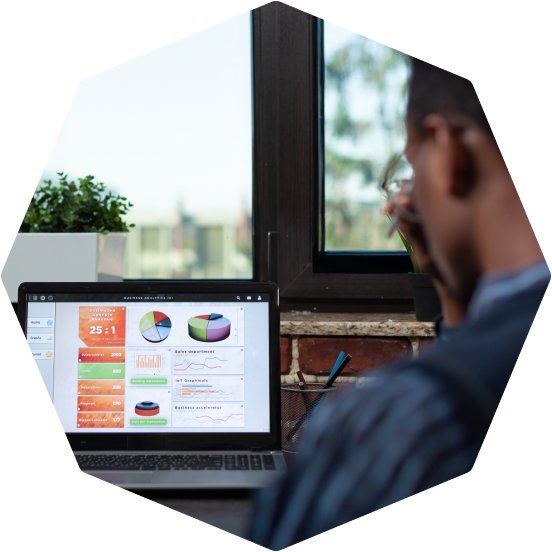

Dashboard Development company in Bangalore
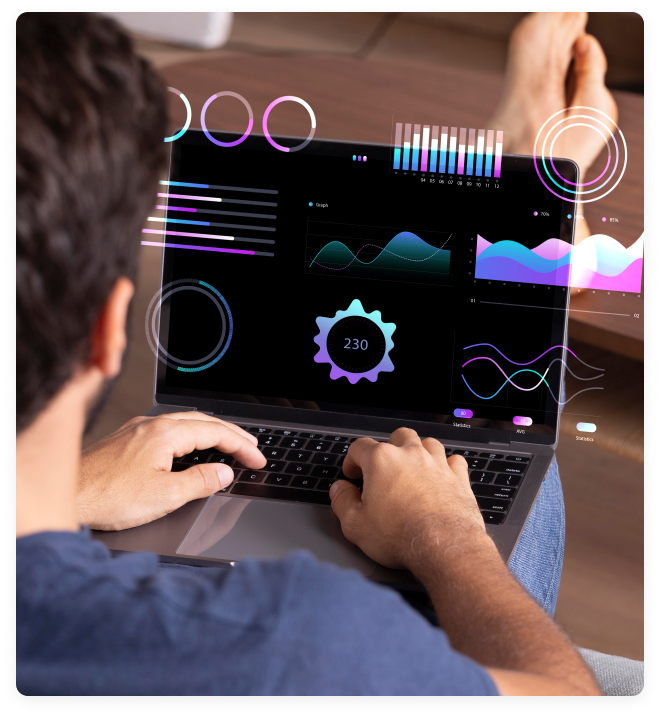
Within our Dashboard Development Solutions, we enable organizations to extract valuable insights from historical and real-time data and information from digital assets that intertwined across business functions. These insights are a foundation for informed decision-making, empowering organizations to develop innovation in their business operation and processes.
Maximize Your Business Effectiveness with Our Customized Dashboard Development Solutions

Committed Technology Team
At Brandstory Solutions, our team comprises proficient developers specializing in Data Visualization. Our solutions assist organizations in seamlessly extracting data from diverse sources, enabling them to assess and make future decisions based on valuable insights.

Augmented Staffing
We are ready to augment resources for Dashboard and Data Visualization projects, enhancing overall productivity. Acquire highly skilled developers from Brandstory Solutions at a cost-effective rate.

Assistance & Upkeep
As a renowned Dashboard & Data Visualization company, we offer a highly professional support and maintenance team. Our team can provide tailored solutions to address any challenges in complex projects.
Business Insight Hub: Dive into Our Dashboard Development Solutions Services

Enterprise Dashboard For Performance
We provide Corporate Performance Management solutions that involve visualization capabilities through personalized dashboards, graphs, and charts. The primary function of Corporate Performance Management (CPM) software lies in data visualization, and we provide affordable CPM software solutions.

Financials
Our financial data visualization solutions allow organizations to represent financial data visually through charts and graphs. A financial dashboard consolidates all necessary data, metrics, and insights to ensure the success of overall performance, transactions, cash management, and profit and loss analysis.

Manufacturing
Our data visualization services for manufacturing companies focus on operations, providing valuable insights for leadership, middle managers, and supervisors. Data visualization aids in monitoring equipment performance, optimizing manufacturing process quality and accelerating product development.

Supply Chain
Our supply chain data visualization service assists in identifying demand drivers to enhance planning accuracy and optimize order management. It facilitates monitoring procurement data, conducting spend analysis, and identifying opportunities. Data visualization helps recognize trends and patterns in the delivery process, allowing for risk prediction and logistics optimization.

Marketing and Sales
We aid in predicting responses to marketing activities for improved campaign planning and budgeting. They support customer segmentation for personalized marketing campaigns, up-selling, and cross-selling strategies. Data visualization also enables customer sentiment analysis and profitability analysis to enhance the sales funnel.

Human Resources
In human resources, we track employee activities to identify performance gaps and enhance staff performance. Visualization of talent management data, including applicant details, current positions, experience, and recruitment requirements, informs decisions in the recruitment process. Monitoring employee performance helps analyze retention activities and identify staff satisfaction drivers to reduce turnover.

Assets
We monitor assets for asset management to determine risks and enhance maintenance management. Predictive maintenance improves the quality of critical assets and contributes to effective asset lifecycle management.

Understanding Hierarchy
Our data visualization solutions support the visualization of extensive data networks, focusing on hierarchical data representation based on the principle of containment. Entities in the data network are related by containment rather than dependency, creating a hierarchical structure for the visualization of big data networks.

Qualitative and Quantitative
Qualitative visualization methods facilitate the collection and analysis of data that cannot be easily understood through numbers, using a data type for labeling variables. Quantitative data, expressed as numbers and measured by numerical variables, can be represented with various graphs and charts such as line charts, bar graphs, and scatter plots.

Using Appropriate Visual Charting
Understanding the audience's interests and needs is crucial for selecting the appropriate visual charting method. Once accurate data is collected, choosing the best visual type—a line chart, bar chart, pie chart, area chart, etc.—is essential. Use our high-quality and affordable data visualization solutions to convey your data information effectively.
Versatility Across Industries: Our Wide-ranging Expertise

Healthcare
Our web development team creates robust healthcare apps adhering to HIPAA guidelines, delivering diverse solutions for this sector.

Retail & eCommerce
We offer cutting-edge technology solutions for eCommerce and retail businesses. Our services cover web development, responsive design, cart development, payment gateway integration, and more. We prioritize user experience design, timely delivery, and cost-efficient solutions.

Travel and Tourism
We specialize in building technology solutions for travel and tourism, focusing on customer communication, online booking, and logistics management. We offer end-to-end travel tech solutions, staying updated on industry trends to provide future-ready solutions.

Education and eLearning
Our eLearning development team employs traditional and innovative approaches, utilizing technologies like AR/VR for enhanced learning. We offer customized e-learning solutions for corporate learning portals, online courses, and learning management systems, fostering employee development.

Banking and Finance Solutions
As pioneers in banking and finance development services, our expert team delivers tailored tech solutions to financial institutions, emphasizing cost-efficiency and scalability.

Logistics and Transportation
Our logistics software development team maximizes return on investment and improves workflow for transportation companies. We offer top-notch logistics software development services to enhance efficiency.

Media and Entertainment
We provide solutions for online promotion, social networking, and media content distribution. We develop software for video streaming, incorporating features like live feeds, ticket booking, and loyalty programs.

Publishing & Advertising
We offer IT solutions for the advertising and publishing industry, supporting businesses in maximizing their reach. Our specialized team ensures modern displays for advertisers and interactive multimedia experiences for publishers.

Automotive
We deliver innovative, customized, and technology-driven solutions for the automotive sector. Our services enhance sustainability and efficiency in automotive software architecture.
Brandstory: Right Choice for Dashboard & Data Visualization Solutions
Uplift your business capabilities with Brandstory Solutions's world-class Dashboard and Data Visualization Solutions. Partner with the industry leader to propel your business to new heights.
Cutting-edge Technology Stack
Our team of data visualization experts ensures that organizations leverage insights from both historical and real-time data to make informed decisions. Stay ahead with our dashboard developers in Bangalore, constantly updated on advanced technologies and trends.
Comprehensive Data Security and Privacy Measures
As a recognized Dashboard and Data Visualization Company, we adhere to high standards in securing client project data, prioritizing honesty in data protection.
Cost-Effective Solutions for Every Business
We offer affordable data visualization solutions tailored to various industries, such as corporate, finance, marketing, and sales. Unlock the benefits of our services at a reasonable price.
Results-Driven Team
Experience result-oriented Data Visualization services with Brandstory Solutions. Our dedicated team consistently works to deliver optimal outcomes for your business.
Cross-Platform Functionality Assurance
Brandstory Solutions ensures seamless application performance across all devices, with our testing team monitoring functionality on various platforms.
Clear and Open Communication
As a reputable Data Visualization service provider, we prioritize transparent communication with clients. Our developers welcome feedback throughout the project.
Round-the-Clock Support
Trust in Brandstory Solutions as your reliable Data Visualization service provider. Our team is available 24/7 to help you with any technical support needed.
Effortless Project Reporting
Maintain clarity in project communication with Brandstory Solutions. Our transparent approach includes regular work reports shared with clients, allowing for feedback and minimizing confusion.


Dashboard Development Process
Submit Your Requirements
This process involves sharing the specifics of your project needs to initiate the process.
Explore Project Viability
During this process, we engage in discussions to check the feasibility and viability of your project.
Select Engagement Model
We take a step forward by choosing an appropriate engagement model that aligns with your project's scope and requirements.
Team Deployment
Once the model is chosen, our team is deployed to work on your project.
Navigate Through Our Engagement Models
Dedicated Team
Tailor your project with dedicated development teams, offering a pay-as-you-go monthly rolling contract. Enjoy 160 hours of part and full-time commitment, transparent billing, and payment based on measurable work.
Time & Material
For undefined Dashboard and Data Visualization projects with ongoing work, opt for hourly engagement, a pay-as-you-go hour-wise rolling contract. This model offers requirement-based working hours, transparent billing, and payment based on measurable work.
Controlled Agile
Opt for controlled agile engagement if your Dashboard and data Visualization project operates on a limited budget and requires flexibility for future changes. Benefit from an agile team, optimal flexibility, suitability for small projects, and complete control over your budget.
Want to drive your Business Success?
CLIENTS
THE GREATEST
Client Testimonials
“Their team showcased unparalleled expertise in creating a dashboard that perfectly suited our business requirements. Their service not only streamlined our data visualization but also significantly improved our decision-making processes.”
Johnathan Lee
“Brandstory went above and beyond our expectations with their outstanding dashboard development services. The team demonstrated a profound understanding of our needs, delivering a solution that not only met but exceeded our expectations.”
Tarah. M
“Opting for Brandstory for our dashboard development was a pivotal decision for our business. The team's innovative approach, technical acumen, and unwavering commitment to deadlines were truly impressive. They transformed our conceptual ideas into an intuitive and visually appealing dashboard, significantly enhancing the overall user experience.”
Amanda Smith
Experience actionable strategies. Customizable to fit your goals.

FAQs
QUESTIONS
We provide comprehensive services for dashboard development in Bangalore, creating custom dashboards and data visualization solutions tailored to meet diverse business needs.